
Do you want to learn how to day trade the opening range breakout? If so, you have come to the right place! In this step-by-step guide, I will teach you everything that you need to know in order to start trading this profitable strategy. I will cover what the opening range is, how to find it, and how to execute a successful breakout trade. So whether you are a complete beginner or an experienced trader, this guide has something for everyone!
How to day trade the opening range!
The first thing that you need to know is what the opening range is. The opening range is simply the range of prices that a stock trades within during the first hour of the trading day. This range is important because it can give you clues about where the stock is likely to head for the rest of the day.
The opening range can be found in multiple timeframes and each timeframe can be used for your trade.
The most popular timeframes are the 3-minute, 5-minute, 15-minute, and 30-minute charts.
You can use any of these timeframes for your trade but I prefer to use the 30-minute chart.
How to find the opening range
The next thing that you need to know is how to find the opening range. The easiest way to find the opening range is by using a stock screener or charting tool.
There are many different stock charting tools out there but my personal favorite is TradingView.
you can read my previous post about 6 best charting software here: 6 Best Stock Charting software for Trading Success
Once you have found a stock charting tool, all you need to do is set the timeframe to whatever you are looking for and then mark the price high and low for that timeframe. Voila! You now have the opening range for your selected timeframe.
You can realistically do this for all of the common timeframes if you want so you can then look at different strategies for each.
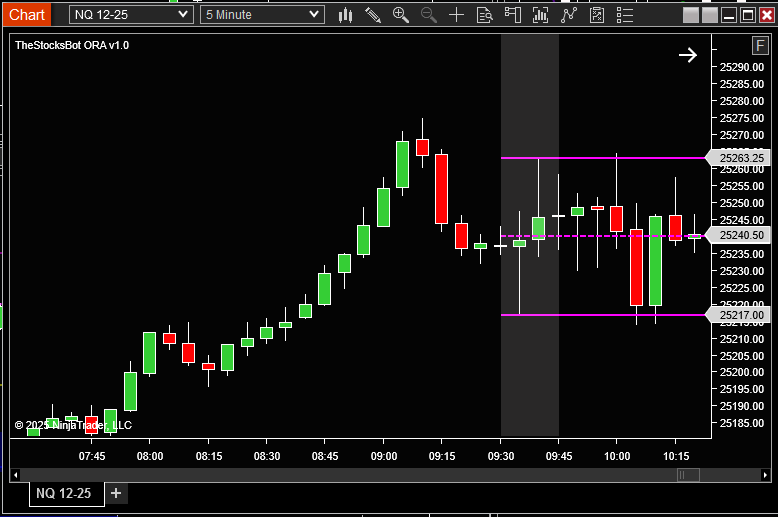
The image above is the 5 minute chart measuring the high and low of the first 15 minutes of the NY session open
How to trade the opening range breakout
Now that you know what the opening range is and how to find it, it’s time to learn how to trade it!
The first thing that you need to do is identify the direction of the breakout.
You can do this by looking at the price action in the preceding minutes, hours, days, or weeks depending on the timeframe you are using.
If the stock has been trading in a tight range for an extended period of time, then there is a good chance that the breakout will be significant.
For shorter term direction you can simply look at the movement of the stock on the lower timeframes ( 1-minute, 3-minute, 5-minute).
Once you have identified the direction of the breakout, you need to wait for the breakout to occur.
The best way to do this is by placing a buy or sell stop order just outside of the opening range.
For example, if you are looking for a long trade, you would place your buy stop order just above the high of the opening range.
If you are looking for a short trade, you would place your sell stop order just below the low of the opening range.
Once your order is triggered, you can then place your stop loss order at a reasonable level and take profit when the price reaches your target.
And that’s it! You now know how to trade the opening range breakout strategy.
What are the risks with opening range breakout strategy?
There are a few risks to be aware of when trading the opening range breakout strategy.
The first risk is that the breakout might not occur.
This can happen if the stock remains in a tight range throughout the day or if there is not enough volume to support the breakout.
The second risk is that the breakout might not be significant.
This can happen if the breakout only lasts for a short period of time or if the price doesn’t move very far.
The third risk is that the stock might reverse direction and trigger your stop loss order.
This can happen if the breakout was not well-defined or if there is sudden news that causes the stock to move in the opposite direction.
What other indicators help confirm opening range breakout?
There are a few indicators that can help confirm an opening range breakout.
The first indicator is volume.
If the volume is higher than usual, it means that there is more interest in the stock and the breakout might be more significant.
The second indicator is price action.
If the price action is strong and decisive, it means that the breakout is more likely to be successful.
The third indicator is momentum.
If the momentum is strong, it means that the stock is more likely to continue in the direction of the breakout.
All three of these indicators can help you confirm an opening range breakout and make sure that you are taking a trade with a higher probability of success.
Summary
The opening range breakout is a simple but effective strategy that can be used to trade the markets.
To find the opening range, all you need to do is find a stock charting tool and mark the price high and low for the timeframe that you are looking at.
Once you have found the direction of the breakout, you can place a buy or sell stop order just outside of the opening range.
And that’s it! You now know how to trade the opening range breakout strategy. Just remember to always use stop losses and take profit levels to protect your capital.
happy trading! :)”
If you have any questions, feel free to leave a comment below or contact me directly. I’m always happy to help! :)”
What are your thoughts on the opening range breakout strategy? Have you used it before with success? Let me know in the comments below!